

Mike Branton

What to Do About the 65% of Checking Customers Making You Money
Brought to you by StrategyCorps


Close
About the authors
Written by
Mike Branton
In a previous article, I wrote about the challenge of how to handle unprofitable customers, headlined “What to Do About the 35% of Checking Customers Costing You Money.” The logical follow-up question is what to do with the remaining 65 percent.
Below is the composition of a typical financial institution’s checking portfolio, based on the relationship dollars (both deposits and loans) each of these segments represent, and the revenue generated by household by segment.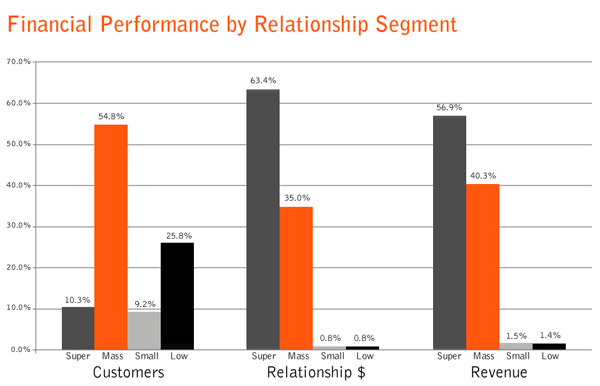
Super: household produces annual revenue over $5,000. Mass Market: produces $350 to $5,000 in revenue. Small: produces $250 to $350 in revenue. Low: produces less than $250 in revenue. Figures are based on the average bank in StrategyCorps’ proprietary database of more than 4 million accounts.
It is commonly thought that the 80/20 rule applies to relationship dollars and revenue for checking customers, where 80 percent of each is generated by 20 percent of customers. However, if you were to add up the Super and Mass columns for the relationship dollars and revenue segments, the “rule” is closer to 98/2 and 97/3, respectively.
Although they make up just over 10 percent of customers, Super households generate the highest percentage of both, 63 percent of relationship dollars and 57 percent of checking revenue for a typical financial institution. Mass households represent the largest relationship segment at 55 percent of customers, but generate less than their pro-rata share of relationship dollars and revenue.
Clearly these two segments, especially the Super segment, are what other financial institutions are looking to steal away with all kinds of marketing messages and incentives, and even some very targeted, prospective individual sales efforts.
A deeper dive into the profile of each segment reinforces why these customers are so sought after by competitors.
| Segments | Super > $5,000 | Mass $350-$5,000 |
| Distribution | 10% | 55% |
| Per Account | Averages | Averages |
| Relationship Statistics | ||
| DDA Balances | $28,079 | $5,746 |
| Relationship Deposits | $63,361 | $6,323 |
| Relationship Loans | $68,250 | $4,542 |
| Total Relationships | $159,890 | $16,611 |
| Revenue Statistics | ||
| Total DDA Income (NII + Fees + NSF) | $1,349 | $448 |
| Relationship Deposit NII | $2,367 | $231 |
| Relationship Loan NII | $2,654 | $171 |
| Total Revenue | $6,370 | $850 |
| Account Statistics | ||
| Have More Than One DDA | 73.2% | 52.8% |
| Have a Debit Card | 46.2% | 65.1% |
| Have Online Banking | 26.0% | 29.6% |
| Have eStatement | 16.0% | 17.5% |
| Debit Card Trans (month) | 8.4 | 15.7 |
| Have a Relationship Deposit | 74.3% | 52.8% |
| Have a Relationship Loan | 56.3% | 25.4% |
| Have Both a Deposit and Loan | 44.4% | 15.8% |
| Average Age of Account | 5.4 | 3.8 |
| Average Age of Account Holder | 57.0 | 51.2 |
The challenge: What should your financial institution do to retain these Super and Mass relationship segments that make up 65 percent of customers and yet are responsible for nearly 100 percent of relationship dollars and revenue?
A common response from bankers when asked this question is their stated belief that people in these Super and Mass segments are long-term customers who are already well-known. However, the data in the next to last row of the chart shows that the average age of the accounts in these two segments is only about five and a half and nearly four years, respectively, so they really aren’t long-term customers on average.
Another popular view is that these customers are already being taken care of. When asked to clarify, the response is typically something general about customer service. Rarely is the response that these customers are being provided with the best products and top level service at the financial institution, or that investments are being made in these customers that are above and beyond what is invested in overall retention efforts. And in too many cases, many community financial institutions don’t have the information organized to even identify which customers are in what segment.
It’s understandable that with today’s tight interest rate margins, compressing fee income and rising operating costs, it’s difficult to make a business case for above average investment in customer retention. However, with an overcrowded competitive marketplace and the commoditization that’s occurring from digitizing retail banking, taking for granted that Super segment customers won’t move is riskier than making the incremental financial investment to do something extra to retain them.
The math on this is straightforward—losing one average Super segment household that generates revenue of nearly $6,400 would require investing in the acquisition of 7.5 average Mass segment households, 29 Small segment households or 88 Low segment households.
The biggest banks know this and are, on a relative basis, out-investing community financial institutions through better mobile and online products, more attractive acquisition incentives and aggressive pricing campaigns in the Super and Mass segments.
While it may feel nearly impossible to invest more in existing Super customers, the cost of not doing so will be much more.
For consumer checking financial performance on all the relationship segments (Super, Mass, Small and Low), a more detailed executive report is available if you’d like more information.
WRITTEN BY